
White space analysis finds unmet shopper needs in a category by comparing what people ask for with what brands already sell. Run it in five steps: define the category, map what exists, collect demand signals, score the gaps, and test the best few. Social video gives early signals, but it shows talk, not purchase intent.
- White space is a shopper need the current shelf does not serve. A white space opportunity is that need plus enough demand to justify a product.
- A white space analysis works best when it uses at least two independent signal types, such as search and social video.
- Score every gap on demand, competitive openness, brand fit, and feasibility before anyone writes a brief.
- Social video surfaces workarounds and wishes early, but it cannot confirm that people will buy. Test the top gaps before you build.
Introduction
Most pages on white space analysis cover sales account planning or broad business strategy. This guide covers the CPG product angle: unmet shopper needs and category gaps, plus how to find them before a competitor does. If you came here for the sales meaning, you are on the wrong page.
What is white space? White space is a need shoppers have that the products on the shelf do not yet serve. In B2B sales the term means something else: the products an existing customer account has not bought from you yet.
The rest of this post is practical. It walks through the method and gives you a scoring table you can copy. Two real examples follow, and so does an honest look at where the method breaks down.
What is white space analysis in CPG?
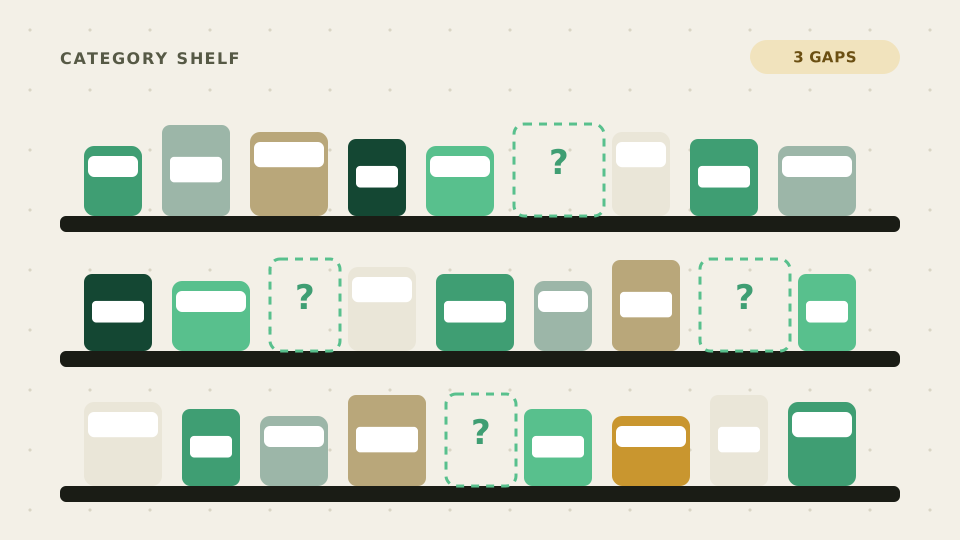
White space analysis is a structured way to find unmet shopper needs inside a category by comparing what consumers want with what brands already sell. The output is a ranked list of gaps in formats, ingredients, claims, occasions, price tiers, or pack sizes that a new product could fill.
Euromonitor's process starts with a review of existing products and the unmet consumer needs they leave open. It then sizes the prize for each gap (Euromonitor). That is a fair summary, and the detail is where teams win or lose.
NIQ's 4th Annual Innovation Vitality Report, which draws on data from over 70,000 manufacturers across 130 categories, found that only 9% of companies expanded innovation sales last year (NIQ). The same release says top launches need a strong idea that meets a real consumer need. They also need a product that beats competitors. Activation has to last past the launch year.
An older Nielsen study of European FMCG found that 76% of new launches failed in their first year. It covered 61,000 SKUs and was published in 2014, so treat it as a historical benchmark (Marketing Week). White space analysis targets the first pillar: picking a need worth serving.
What is a white space opportunity, and how is it different from a market gap?
A white space opportunity is an unmet need with enough demand, and enough room from competitors, to support a new product. A market gap is only something missing from the shelf. Every opportunity is a gap, but many gaps stay empty because nobody wants what would fill them.
Spate puts the idea simply: whitespace is the gap between what consumers want and what is currently available (Spate). The word "want" is the filter. A gap with no evidence of wanting is a hole, not an opportunity.
Here is a quick test. If you can name the shopper and the moment of use, and you have proof that people are asking for it, you have an opportunity. If you can only say "nobody makes this," you have a gap.
Whitespace analysis and white-space analysis are spelling variants of the same thing. So is "white space mapping" in most CPG teams.
How do you do a white space analysis for a product?
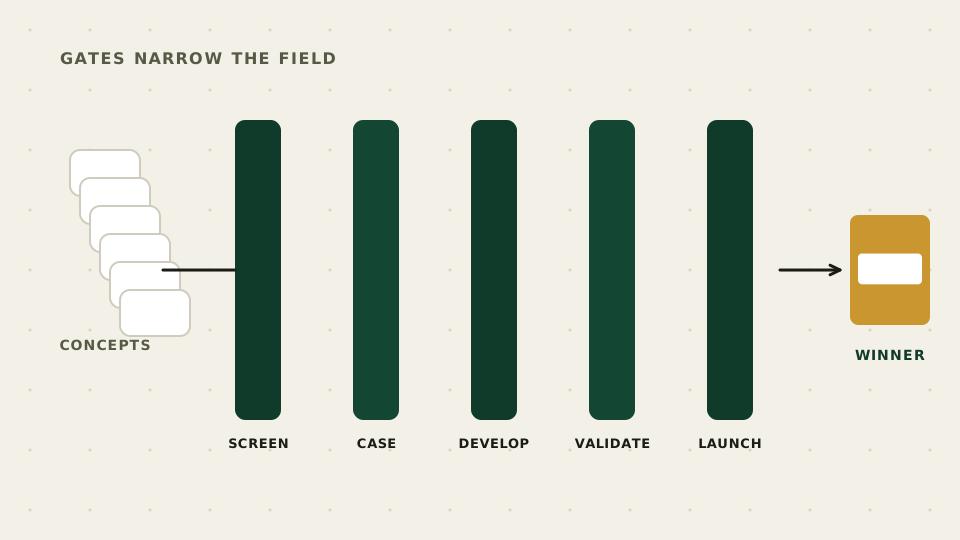
Run a white space analysis in five steps: define the category, map what exists, collect demand signals, score the gaps, and test the top few. Each step of a white space analysis produces one artifact, so a team can pause after any step and still have something useful to show.
Step 1: Define the category the way shoppers do
Shoppers buy by need and occasion, not by your internal category tree. Write a one-sentence boundary, such as "snacks eaten between meals that a parent would call filling." Then list two or three adjacent categories your shopper also considers. A boundary that is too tight hides the best gaps, which often sit at the edge of two categories.
Step 2: Map what exists
Build a grid with products down the side and attributes across the top. Useful columns are format, key ingredient, main claim, price tier, occasion, and pack size. Euromonitor's first step is the same idea: review existing products, including the target consumer, key claims, and value propositions (Euromonitor).
Empty cells in the grid are candidate gaps. They are not opportunities yet.
Step 3: Collect demand signals
Now ask whether anyone wants what the empty cell would hold. Use more than one source. Spate suggests favoring steady year-over-year growth in search over a single spike. It also points to social platforms like TikTok for topics gaining momentum, and to questions many people ask that no brand answers (Spate).
Euromonitor triangulates product audits, retailer interviews, social listening, consumer surveys, and expert interviews. A practical rule for your own team: no gap enters the scoring table with fewer than two independent signal types behind it.
Step 4: Score the gaps
Give each gap a 1 to 5 score on demand, competitive openness, brand fit, and feasibility, then weight the scores. The template in the next section does this. Scoring turns a white space analysis from a brainstorm into a debate about evidence.
Step 5: Test the top few
A score is a hypothesis. Take the top gaps into concept testing before you commit to development, where shoppers react to a specific product and claim at a specific price. If a gap survives that test, your white space analysis has produced an opportunity worth a brief.
Where does social video show white space that surveys miss?
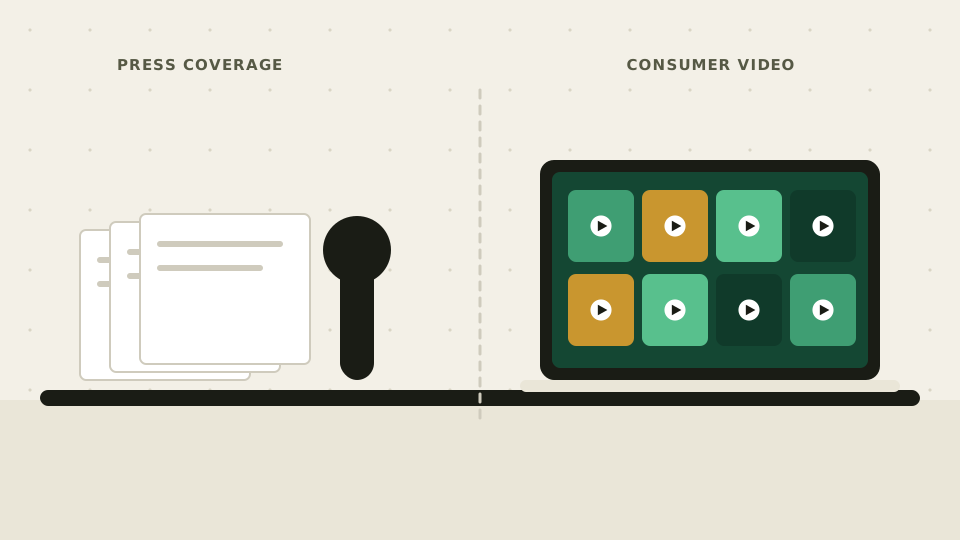
Social video shows shoppers describing problems and workarounds in their own words before any brand has built a product for them. A survey measures only what you thought to ask. The comments under a video often hold the unprompted complaint or hack that points to a gap.
Reach matters here.
Pew found that 84% of US adults say they ever use YouTube, and 50% use Instagram. Another 37% use TikTok. In a separate Pew survey, 24% of adults said they use TikTok daily (Pew Research Center). Those figures cover US adults only, so UK teams should look for local data before sizing anything.
What to look for in video and comments:
- Repeated "does anyone make this?" questions
- Homemade fixes, such as people combining two products to get one result
- Complaints about a format or a pack size that recur across creators
- A niche term that appears in comments before it appears on shelves
These signals are early because they show up while the need is still unserved. For a deeper look at how machines read video at scale, see our post on AI video analysis. For the wider research context, see consumer insights.
Now the honest limit.
Social video shows what people do and say in public. It does not show purchase intent. People who post and comment are not the whole shopper base, and a loud topic can still be a small market. Treat social video as the best source for where to look, then use sales data and testing to decide what to build.
What does a white space analysis template look like?
A white space analysis template is a table with one row per gap and a 1 to 5 score for demand, competitive openness, brand fit, and feasibility. A weighted total ranks the rows. Copy the table below into a spreadsheet and change the weights to match your strategy.
| Gap (illustration) | Demand (35%) | Openness (25%) | Brand fit (20%) | Feasibility (20%) | Weighted score |
|---|---|---|---|---|---|
| Single-serve savory protein snack for afternoon work breaks | 4 | 4 | 3 | 4 | 3.80 |
| Kids' version of an adult electrolyte drink | 3 | 2 | 4 | 5 | 3.35 |
| Shelf-stable dip that tastes like a fresh one | 2 | 5 | 2 | 2 | 2.75 |
Illustration, not a client result. The gaps and scores are invented to show the arithmetic.
The formula is: weighted score = 0.35 x demand + 0.25 x openness + 0.20 x brand fit + 0.20 x feasibility. The weights are a starting point. A challenger brand may weight openness higher, and a large company with fixed plants may weight feasibility higher.
Define each scale before anyone scores:
- Demand: 1 means one weak signal source. 5 means several independent sources with steady growth.
- Openness: 1 means three or more strong products already serve the need. 5 means none do.
- Brand fit: 1 means shoppers would find the product odd coming from you. 5 means it is a natural extension.
- Feasibility: 1 means new sourcing and new equipment. 5 means your current supply chain can make it.
For a fair white space analysis, have two or three people score separately, then compare. Large gaps between scorers show where the team disagrees about evidence.
Is there a real example of white space analysis in CPG?
In practice, white space analysis ends in a short list of named product territories, each backed by the volume of conversation behind it. Two Convosight case studies show the pattern: one maps unmet needs in child nutrition, and the other compares skincare and nutrition conversations to find format, function, and messaging gaps.
In the product innovation intelligence case study, a leading healthcare company wanted to understand unmet needs in the child nutrition category in Vietnam. The page reports analysis of 40K+ conversations and 8,000+ video content signals, which produced nine product concepts, two of them described as breakthrough innovations. It describes a "Whitespace Mapping Engine" that looks for unaddressed territories in what a product is and how it is described.
A second Convosight case study, on cross-category innovation, covered a leading health and wellness company in Mexico. It analyzed 9,354 posts and 226K comments across TikTok, Instagram, YouTube, and Facebook, plus community conversations. The opportunities it names include flavor-first children's products and plant-based performance solutions for adults. It also names community-first engagement for diabetes care.
Neither page reports what the clients launched or sold afterward, so read them as examples of method and output, not proof of results. The method is the useful part: many signals in, a few named territories out.
What mistakes ruin a white space analysis?
The most common mistakes are treating an empty shelf as proof of demand, trusting a single data source, ignoring brand fit, and skipping the test. Each one produces a confident list of ideas that no shopper asked for. Most are fixed by process, not by better software.
- Confusing a gap with demand. Empty shelf space can mean opportunity or a dead idea. Require evidence of wanting.
- Chasing a spike. A viral week is not a trend. Spate advises favoring steady year-over-year growth over a single peak (Spate).
- Defining the category too narrowly. If your boundary matches your internal org chart, the best gaps will sit outside it.
- Stopping at the idea. NIQ's three pillars include a product that outperforms competitors and sustained activation, so a good gap still needs a good product and a plan (NIQ).
- Reading social talk as purchase intent. Talk is a lead. Sales data and testing confirm it.
How does Convosight help with white space identification?
Convosight reads video and comments from TikTok and Instagram as well as YouTube, and turns them into structured insight for CPG teams. Insights and innovation teams use it to look for unmet needs and white space in a category, then take the shortlist into concept and claim testing.
By Convosight's own figures, the platform has watched and analyzed 500M+ videos and 2B+ conversations. It is trusted by Unilever, Abbott, Kenvue, Pepsi, SC Johnson, and Kimberly-Clark. The case studies above show the output on a real brief.
One honest take: Convosight is a poor fit when your category is bought mostly in store and rarely discussed in public video. In that case, retail panel data and shopper interviews will tell you more. Even where video is rich, you still need sales data to size a gap.
Book a demo to see how Convosight identifies white space in your category.
FAQ
What is white space analysis?
White space analysis is a method for finding unmet needs in a category by comparing what consumers want with what brands already offer. In CPG, the result is a ranked list of product gaps, such as formats, ingredients, claims, or occasions, that a new product could fill.
What is a white space opportunity?
A white space opportunity is an unmet shopper need that has real demand and enough room from competitors to support a new product. It needs a named shopper with a clear moment of use, and evidence from more than one source that people are asking for it.
What is the difference between white space and a market gap?
A market gap is anything missing from the shelf. White space is a gap that shoppers actually want filled. Many gaps stay empty because there is no demand, so evidence of wanting is what separates a white space opportunity from a hole in the assortment.
How do you do a white space analysis for a product?
Define the category the way shoppers see it, map existing products by attribute, collect demand signals from at least two sources, score each gap on demand, openness, brand fit, and feasibility, then test the top gaps with shoppers before development begins.
Is there a white space analysis template?
Yes. Use a table with one row per gap and 1 to 5 scores for demand, competitive openness, brand fit, and feasibility. Weight the scores, add them up, and rank the rows. A full example with weights and scale definitions appears in the template section above.
What does white space mean in sales?
In B2B sales, white space means the products or business units inside an existing customer account that you have not sold to yet. It is an account-growth tool. This guide covers the CPG product meaning instead, which is about unmet shopper needs in a category.