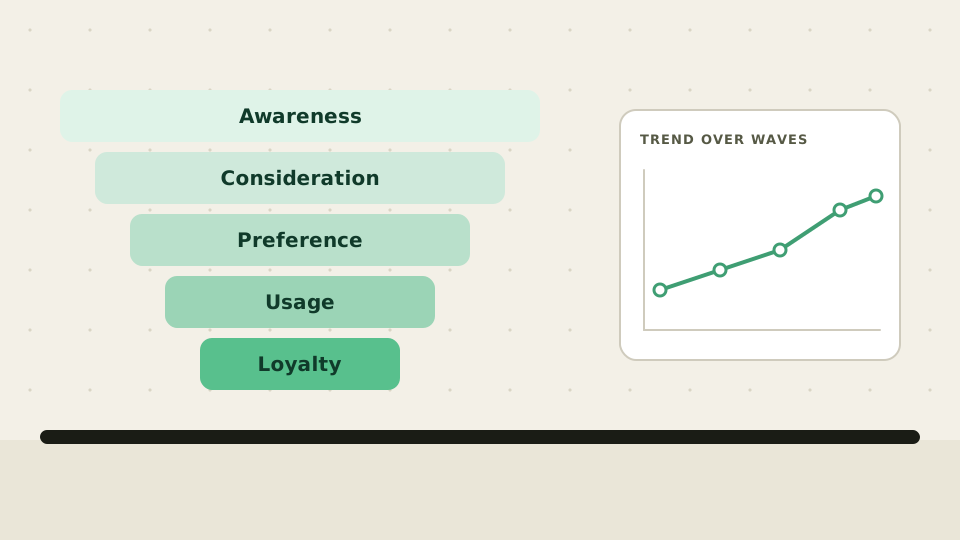

Brand tracking repeats the same measures on a fixed schedule, so you can see whether awareness, consideration, and loyalty are moving. Survey trackers remain the standard for a representative read, and they run in waves. Social video adds an always-on signal between waves. Use both, for different jobs.
- Brand tracking works because the questions, the audience, and the timing stay fixed. One reading says little. The trend is the result.
- Core metrics follow the funnel: awareness, consideration, preference, usage, and loyalty, with brand associations alongside.
- Surveys give a representative read of awareness and consideration. Social video shows what people say and show between waves. Sales data shows what they buy.
- Set the cadence by your purchase cycle and campaign calendar, then keep it steady.
Brand tracking often shows up as a quarterly survey deck that few people act on. The harder questions come after the fieldwork: which metrics matter, how often to run it, and what to do with the signals that arrive between waves. This guide defines brand tracking, sets out the metrics and the methods, and shows which method can see which metric. It treats tracking as one input to wider consumer insights work for CPG teams.
What is brand tracking?
Brand tracking is the repeated measurement of how consumers see, choose, and use a brand, run on a set schedule so each reading can be compared with the last one and with competitors, and Attest frames it as following a brand's progress over time, whether the brand is yours or a rival's (Attest).
A one-off study tells you where you stand today. Tracking tells you whether you are moving, and whether a campaign, a price change, or a rival's launch moved you. Attest notes that the first survey sets the baseline, and later waves are often timed around events such as ad campaigns.
The idea is simple. The craft is in keeping every wave comparable.
Which metrics does brand tracking measure?
Brand tracking metrics usually follow the purchase funnel, from awareness through consideration, preference, and usage to loyalty, with brand associations measured alongside, and SurveyMonkey lists awareness, consideration, preference, and advocacy as the core funnel and treats purchase as a further stage (SurveyMonkey). Labels vary by vendor, but the ground is the same.
What is the brand funnel? The brand funnel is the path from knowing a brand to buying it again. Each stage gets its own metric, so you can see where people drop away.
- Unaided awareness: Do people name your brand with no prompt? Kantar calls it a strong sign of top-of-mind presence (Kantar).
- Aided awareness: Do they recognize it when they see the name or logo? Comparing it with unaided awareness shows how much reinforcement the brand needs.
- Consideration: Is the brand on the shopper's shortlist?
- Preference: Do people prefer your product to a rival's? Qualtrics describes this as the share of consumers who would rather buy your branded product than the competitor's (Qualtrics).
- Usage and purchase: How often do people buy or use it?
- Loyalty and advocacy: Will they buy again, and will they recommend it? Net Promoter Score asks how likely someone is to recommend the brand on a 0 to 10 scale. Scores of 0 to 6 count as detractors and 9 to 10 as promoters, and the score is promoters minus detractors (Attest).
- Brand associations: What do people link to the brand? Qualtrics says open-text answers, analyzed by topic, suit this best.
For CPG, Kantar adds needs-based salience, which is how easily a brand comes to mind in a buying situation. Kantar also warns against packing brand health, customer experience, and campaign performance into one survey, since that makes interviews longer and data worse.
How many metrics should you track? Drive Research advises starting with five to seven core metrics, tracking them consistently, and building out as the program matures (Drive Research).
What are the main brand tracking methods?
Brand tracking methods fall into five groups, which are continuous survey trackers, periodic survey waves, social listening, search data, and sales data, and the first two ask a defined sample the same questions each time while the other three observe what people already say or do. Each answers a different question, and none covers the whole funnel alone.
- Continuous survey trackers. A small number of people are interviewed every day or week, and results roll up into a moving trend. This suits teams that want to see a campaign effect without waiting for the next wave. Each day's sample is small, so read the rolling total, not any single point.
- Periodic survey waves. The same questionnaire is fielded at set intervals, such as quarterly. This is the most common format, and it gives the cleanest comparison between two points in time.
- Social listening. This counts and reads public posts, comments, and videos that mention your brand and your rivals. Drive Research treats social mentions as a supplement to surveys for awareness, not a substitute. For the video side, see our explainer on social listening on TikTok.
- Search data. Google Trends scales interest from 0 to 100 as a share of all searches in a place and period. Google says it shows relative popularity, not absolute volume, and that Trends is not a poll (Google Trends Help).
- Sales data. Retailer, shopper-panel, and company data show what people bought. They do not show why.
Together these produce your brand tracking data. The skill is not in collecting more of it. It is in knowing which source can answer which question.
Which brand metrics can surveys, social video, and sales data each measure?
A survey tracker measures awareness, consideration, and preference best, because it asks a defined sample the same questions each time, while social video shows how people talk about and show a brand, which suits associations, emotion, and early change, and sales data measures purchase. Some questions, such as cause, need a test.
| Metric | Survey tracker | Social video | Search and sales data |
|---|---|---|---|
| Unaided and aided awareness | Measures, on a defined sample | Not measured; shows mention volume among people who post | Search interest is a rough proxy |
| Consideration | Measures, with a shortlist question | Partly: comparison and switching talk | Not measured |
| Preference | Measures, against named rivals | Partly: stated favorites in comments | Share of sales shows what was chosen |
| Usage and purchase | Self-reported | Shows use in context | Sales data measures it |
| Loyalty and advocacy | NPS and repeat intent | Partly: recommendations and complaints | Repeat rates, where the data allows |
| Associations and tone | Fixed attributes or open text | Observes unprompted, in people's own words | Not measured |
| Change between waves | Slow, by design | Observes as it happens | Search spikes and sales lag |
| Why a metric moved | Open questions suggest reasons | A clue, not proof | Shows what, not why |
Three gaps remain whatever you choose. People who neither post nor answer surveys are unseen. Private categories get little public talk. And cause needs a test, such as a market with the campaign and one without.
Our view: surveys remain the standard for representative awareness and consideration. Social video is an additional signal, not a replacement.
How often should you run brand tracking?
Run waves as often as your purchase cycle and campaign calendar justify, then keep the interval fixed, because guides differ: SurveyMonkey says most teams field waves quarterly or bi-annually, Qualtrics says annual or semi-annual runs suit most companies, and Attest cites every three or six months. Fast-moving categories may justify monthly.
The quantilope guide gives the most useful rule for CPG: tracking frequency should mirror what is realistic for your market's buying habits, so yogurt or potato chips may suit more frequent tracking, while furniture or cars suit less (quantilope).
Consistency matters more than cadence. SurveyMonkey advises setting the interval before launch and sticking to it, since irregular timing makes waves hard to compare. It also suggests at least three waves before you call a direction.
Our honest take: a category bought weekly and driven by promotions can earn monthly waves. A slow category cannot, and the money is better spent on sample quality.
How do you read brand tracking data?
Read brand tracking data as a trend against a baseline and against competitors, not as single numbers, because a small move in one wave can be noise, so wait for a pattern, compare each funnel stage with the next to find where people drop away, and pair every move with a possible cause from your own calendar.
Four habits make the read dependable:
- Anchor on the baseline. The first wave is your reference, and every later wave answers one question: better or worse than then?
- Always show rivals. A rise in awareness means little if the category rose faster.
- Read stage to stage. Illustration, not a client result: if aided awareness holds steady while consideration falls, people still know the brand but like it less. That points to perception, not reach.
- Respect the margin of error. Samples are finite, so a move inside the margin is not a finding. Say so in the deck.
Then lay the other sources on the same timeline. A search spike, a burst of social talk, or a sales dip that lines up with a survey move is worth a closer look. It is evidence, not proof.
What do the related brand tracking guides cover?
This guide covers the whole practice of brand tracking, and four companion guides go deeper on narrower questions: how to read overall brand health, how to choose software, how to read sentiment, and how to design the survey questionnaire and sample. Each short answer below links to the full version.
- Brand health. Brand health is the combined read of the funnel stages, and SurveyMonkey separates it from brand equity, which covers the value and associations attached to the name. Full guide: how brand health tracking works.
- Software. Tracking tools range from survey platforms to social listening products. Choose by which metrics in the table above the tool can actually measure. Full guide: what to compare in tracking software.
- Sentiment. Sentiment is the tone of what people say about a brand. It comes from text and video, not funnel questions, so treat it as a signal and not a score. Full guide: reading sentiment toward a brand.
- Surveys. The survey is the backbone of most programs: questions, sample, and wave design. Full guide: designing the tracker questionnaire.
What is changing in brand tracking?
The shift is from measuring only in waves to adding signals that run all the time, with survey waves still anchoring the read while social video, search, and sales data fill the weeks between them, which adds frequency but not representativeness, so the survey stays the reference point for who thinks what.
Start with the limits. Pew's 2026 survey of 5,511 U.S. adults found 84% use YouTube, 51% use Instagram, and 31% use TikTok. TikTok use is 65% among adults 18 to 29 and 11% among those 65 and older (Pew Research Center). A read of one platform will skew by age before you analyze a single clip.
What always-on adds is speed and language. Convosight's own social crisis response case study describes a frozen dessert maker facing a viral Instagram reel that questioned product quality. Engagement and sentiment were tracked hourly, and the page reports 12M+ impressions and that alternative brands were mentioned positively in 74% of comparative comments. A quarterly wave cannot watch an event like that unfold.
Reading clips and comments at that scale relies on AI video analysis, which has its own limits, covered in that guide.
How does Convosight fit into brand tracking?
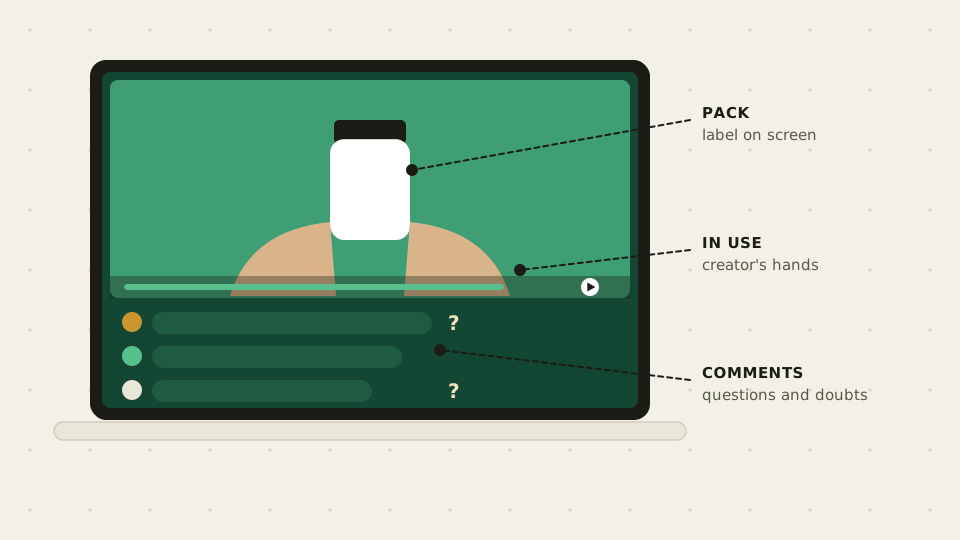
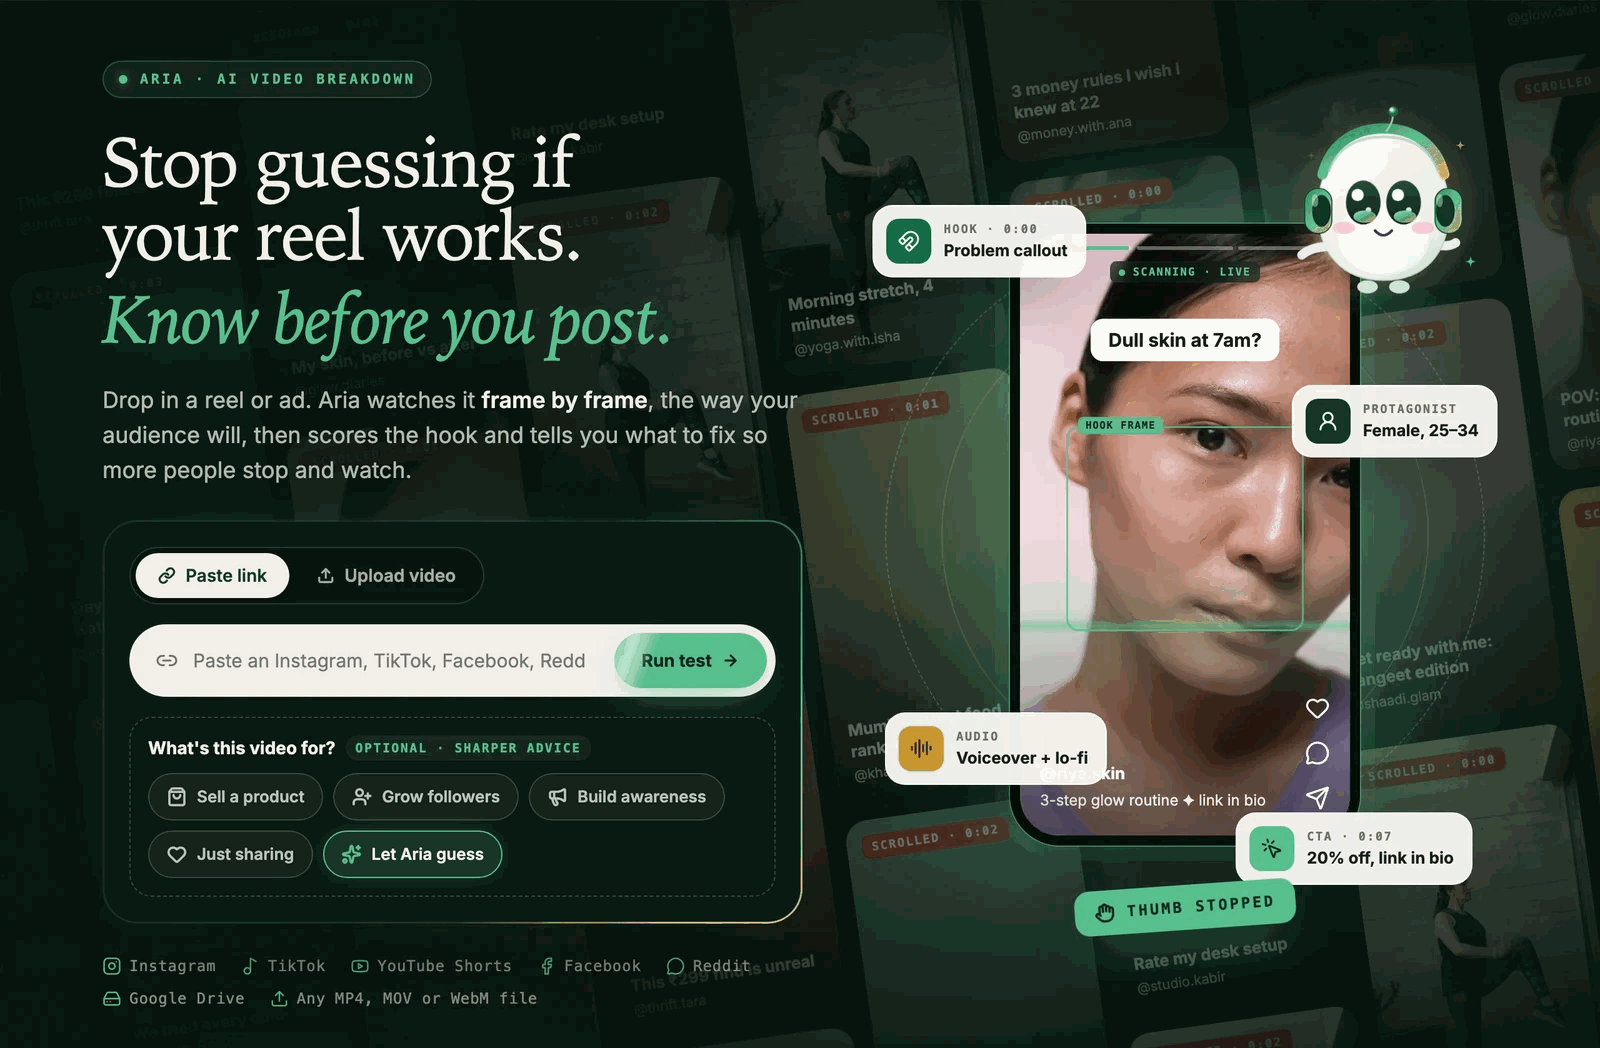
Convosight gives brand teams an always-on read of social video to sit beside survey waves, through its assistant Aria, which answers questions from social video and has a preset job called Brand & Competitor Sentiment, and its Persona feature, which tests messages and claims with consumer twins. Neither replaces a survey tracker, and neither is built to.
Per Convosight's site, you ask Aria a question in plain language or pick a preset job such as Consumer Understanding or Content Strategy. Answers are sorted into what people said, showed, felt, and left unsaid. Each answer comes with the clips and comments behind it, plus metrics such as views, likes, comments, and engagement. Convosight states that Aria draws on 500M+ videos and 2B+ conversations across 9+ channels and 120+ languages (Convosight's own figures).
Persona sits on top. Convosight describes it as building consumer twins from social conversations, so a team can take an insight from Aria and pressure-test a pack claim before launch. Aria can also be connected to AI tools such as Claude, VS Code, and Cursor, as the MCP support page explains. Convosight is trusted by Unilever, Abbott, Kenvue, Pepsi, SC Johnson, and Kimberly-Clark.
Be clear about the limits. Aria and Persona read what people say and show in public video. Convosight does not publish accuracy or validation figures on these pages, so check any read against your own tracker. A practical split: keep the survey as the scorecard, use the always-on read to explain moves and flag issues between waves, and test a claim with Persona before paying for a new wave.
To see how that would work on your categories and rivals, Book a demo.
FAQ
What is brand tracking?
Brand tracking is the repeated measurement of how consumers see, choose, and use a brand, run on a fixed schedule. Because the questions and audience stay constant, you can compare each reading with the last and with competitors, and see whether awareness, consideration, or loyalty is moving.
How often should you track a brand?
Most guides point to quarterly or twice-yearly waves, with annual runs for slow categories and monthly runs for fast ones. Match the cadence to your purchase cycle and campaign calendar, set the interval before launch, and keep it fixed so waves stay comparable.
What are the main brand tracking metrics?
The core metrics follow the funnel: unaided and aided awareness, consideration, preference, usage, and loyalty or advocacy, often measured with Net Promoter Score. Many programs add brand associations. Drive Research suggests starting with five to seven metrics and adding more as the program matures.
What is the difference between brand tracking and brand health tracking?
Brand tracking is the practice of measuring a brand repeatedly over time. Brand health tracking usually means the combined read of the funnel stages that practice produces. Vendors often use the two terms almost interchangeably, so check which metrics a given report includes.
Can social media data be used for brand tracking?
Yes, as an additional signal. Social data shows unprompted language, tone, and early change between survey waves. It cannot give a representative read of awareness, because only people who post are visible and platform use skews by age. Pair it with a survey tracker.
Is brand tracking only for big brands?
No. Attest says tracking is far more accessible and affordable than it used to be, so smaller brands can run a short tracker with a few core metrics. SurveyMonkey recommends eight to 10 questions. Start small, keep it consistent, and add metrics as you grow.
Related reading
- Brand health tracking for CPG teams: how the funnel metrics combine into one read of brand strength.
- A closer look at brand tracking surveys: questions, samples, and wave design.
- Brand sentiment tracking explained: what tone in public talk can and cannot tell you.
- Consumer insights for CPG: examples and methods: where tracking sits among other research methods.